OpenCV aka Open Source Computer Vision Library is written in C++, but includes bindings for Python, Java and MATLAB. Additional wrappers are available from third parties to utilize the broad spectrum of tools in multiple languages. OpenCV is used for image and video processing, analysis, and manipulation. OpenCV contains tools for segmentation, object detection, facial recognition and motion tracking, as well as including a statistical machine learning library.
To start using OpenCV, after installing using pip, import using the name cv2, which is counterintuitive, but c’est la vie.
pip install opencv-python
import cv2
Next, importing images is pretty straight forward using the following command to read in color or grayscale:
grayscale_img = cv2.imread('filename.jpg', cv2.IMREAD_GRAYSCALE)
color_img = cv2.imread('filename.jpg', cv2.IMREAD_COLOR)
Following the filename string in the cv2.imread code, there are several optional flags which can be explored in the documentation for OpenCV. The IMREAD_GRAYSCALE flag reads the image in grayscale using the internal codec which differs from operating system to operating system, and this can be done later very easily, so I will import using IMREAD_COLOR for the example. A note here, OpenCV uses BGR(blue/green/red) rather than RGB(red/blue/green) and if importing the image like this, the conversion is done on import, but there are options using Color Conversion codes later as well.
Since I will want to display my images in Jupyter Notebook, I am just going to plot them easily inline using the following code:
#import matplotlibimport matplotlib.pyplot as plt
%matplotlib inline
#import matplotlib
import matplotlib.pyplot as plt
%matplotlib inline

#create function to display image
def show_img(image):
    plt.imshow(image)
    plt.axis("off")

#alternative method opening image in separate window
def show_img(window_name, image):
    cv2.imshow(window_name, image)

#additional actions needed to prevent crashing

#user action required, press any key
cv2.waitKey(0)

#closing all open windows
cv2.destroyAllWindows()
For a quick example, I will import and display an image from the Cat/Dog Dataset that can be found on Kaggle.
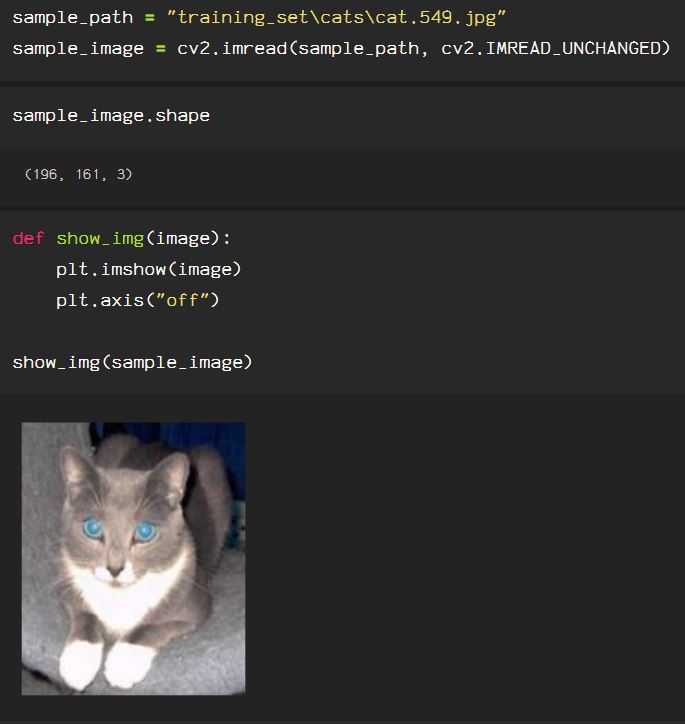
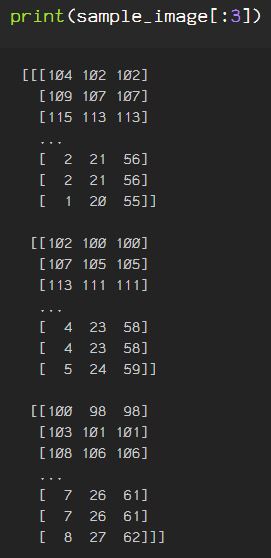
The information for the image is stored in the sample_image variable, and the shape of the data can be seen with .shape. The actual data ‘points’ can be seen with print() to print the array, the three columns represent the blue, green, and red levels for each pixel in the image.
Or, view it as a list of 196 items

Then, to get a solid grasp on the shape of the image and how the images will be accessed throughout any image or video machine learning process, video editing, or digital enhancement process, we can see the width for the image in pixels horizontally by looking at each row in the array through printing the len() for any one item in the img_as_list variable above. This is not used to code anything, just to explain how to work with image data, so when manipulating the image at any point, you can see how the actual data is affected and where the image actually comes from, as the image is just numbers.

Each point has information for 3 attributes, Red, Green, and Blue. Each number represents information for the colors seen in an image.
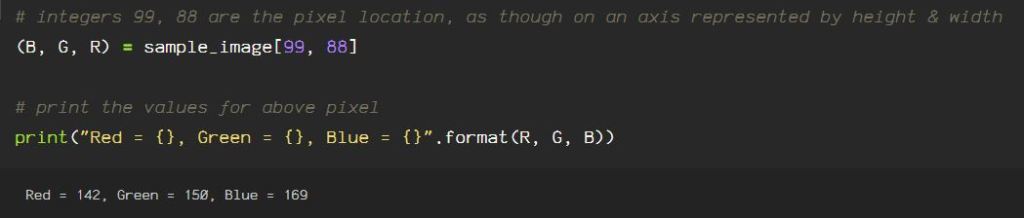
Select a pixel at random, choosing a number within the .shape specs, and then you can see the information contained for that pixel contained in each digital image file.
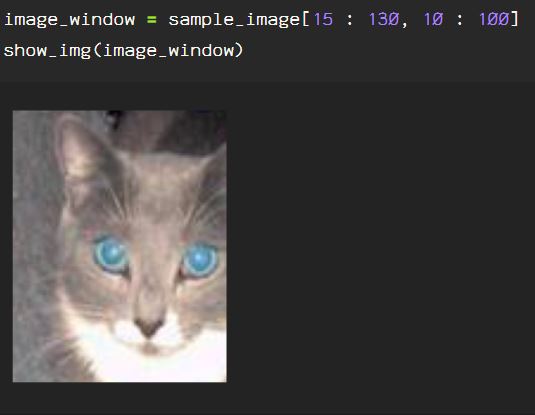
To select a portion of the image just slice the sample_image data, using two integers and the data between those two numbers is selected, the first number representing the height. Adjusting the numbers adjusts the portion of the image displayed from top to bottom, and left to right.

The first set of numbers represents the top of the image : the bottom of the image, shown below, the window is moved, accordingly:

The first set of numbers represents the top of the image : the bottom of the image, by pixel.

The second set of numbers represents the width, left and right sides of the image, by pixel.

Earlier, I mentioned Color Conversion codes, which can be used with the cv2.cvtColor() method, and asserting the appropriate color code information flag.
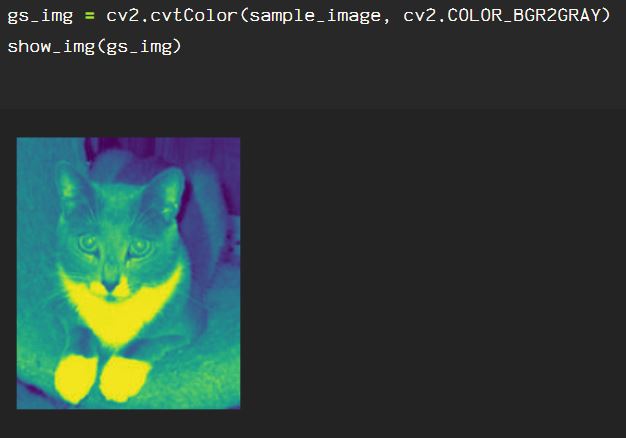
As you can see in the image above, it is supposed to be in grayscale, and technically, the image is in grayscale with 2 channels, rather than the 3 channels in a BGR or RGB image, but the ‘cmap’ flag must be set for matplotlib to display it in the intended grayscale.

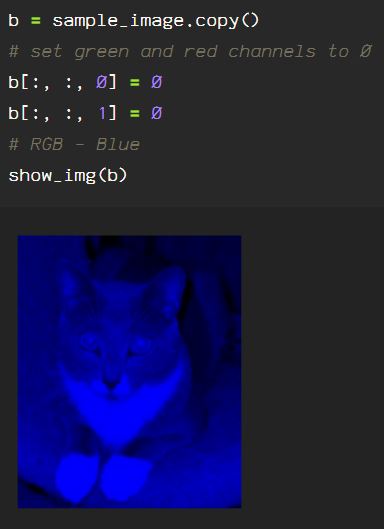
The channels in the image can be manipulated individually as well. To remove the red and green channels, the blue channels are left on the image, unaltered here:
The same can be done by zeroing out the blue and red channels, leaving only green:

Now, zeroing out the blue and green channels leaves us with the red channel.

These are just a few examples of what OpenCV allows you to do with an image file to show exactly what the data in an image file actually represents and how the user can use this for a multitude of applications.
