Working on an NLP task, there are times when you need to be able to visualize representation of tweets. This can be super useful in classification tasks. Using Gensim’s Doc2Vec, and the following packages:

I will be creating word vectors, training them and then plotting the word vector as an image.
I am using a multicore processor and will assign it as the ‘cores’ variable to be utilized in the next line of code, in which I create an empty Doc2Vec model. I do this so that I can train my word tokens to fit the train_tagged.values to DocumentBagOfWords model, or dbow, and call it ‘model_dbow’.
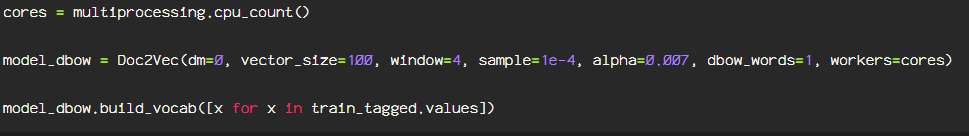
I am running 20 epochs and increasing the alpha each iteration.

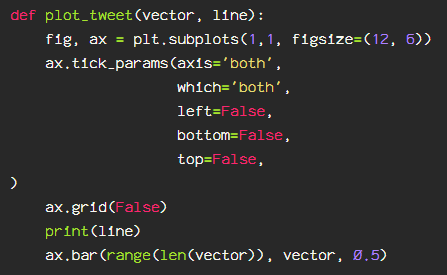
Then, I create the actual graph on which to plot the vector representation.
Then I define a function to show the tweet at the index number I specify.
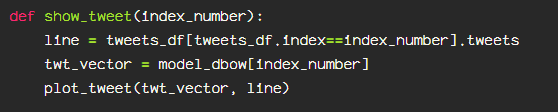
Then just choose a random, previously denoised, tokenized tweet.

Any document(tweet, in this case) can be visualized from any index in your dataset.

