Audio analysis in machine learning can be done using complete audio timelines or extracting information from certain features. Depending on the end goal, there are a multitude of methods one can use to analyze audio.
Common applications for machine learning in audio classification include speech recognition, music tagging, and fingerprinting. My capstone project was done on audio classification, and I chose to classify bird species based on their calls and songs. I obtained the data from https://www.kaggle.com/c/birdsong-recognition.

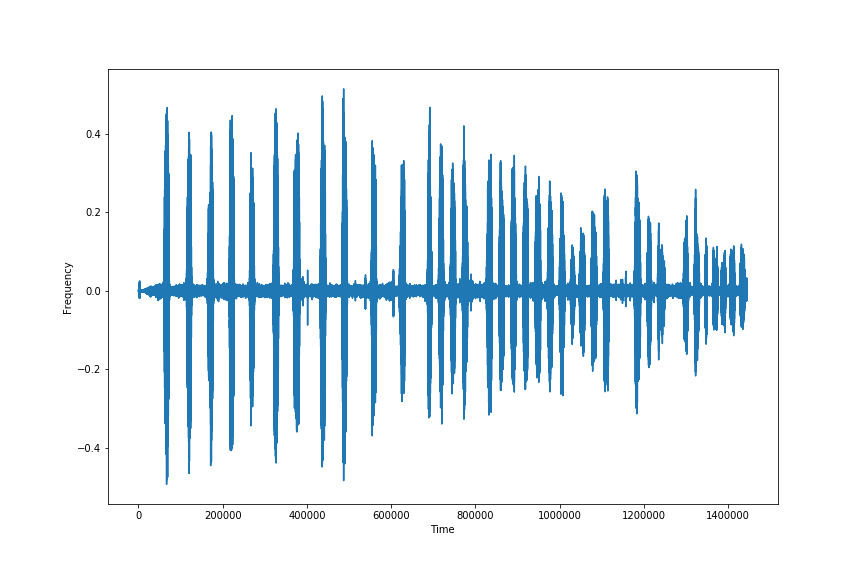
The audio was in mp3 format, and there aren’t a lot of libraries for audio analysis, and Librosa, being one of the most common, requires wav formatted audio files. I started by using the Pydub and Soundfile libraries to convert the mp3 files to wav formatted files. Next, I sliced the files using pydub’s split_on_silence feature. Rather than removing the actual silence, I increased the threshold so as to remove the excess background noise, as there is not only ambient/environmental sound present, but there are squirrels, other birds, and a variety of extra ambient noise present in the audio tracks. I chose the split on silence module because I wanted to actually split the audio track rather than re-leveling the audio, which would change the pitch and quality of the audio files. Below is an example of the information obtained through the wav analysis, which essentially shows the power at certain points and around the 0.0 mark across the center, is the ambient and background noise present throughout the clip.

The above image is the melspectogram extracted from the same audio file. Setting the lifter to 2.0, so as to focus on the power of the audio file, you can see the light pink color that reflects the call of this bird.
Deciding what features to work with was one of the many hurdles I encountered. There is so much information in sound, from pitch, to frequency, to power. All of these have to be extracted with consideration to the extraneous sound present on a track when it is obtained in certain environments. This was consistently the case for the dataset I worked with for this project.
Since audio is actually linear, I initially intended on sticking with the wav and chromagram information, but upon doing some research, I found that the melspectogram represents audio as human’s perceive it on the log scale. I extracted a variety of information through statistical analysis to utilize in my neural network. I worked with the onset envelope, to get an idea of the power behind the bird call for each file. I assessed the spectral deviation, which involves taking the standard deviation from the chromagram information extracted for each frame of audio. I assessed the mean mel cepstral coefficients from the audio tracks as well. These assist in provided key information on the mel scale through coefficients obtained in a frame by frame analysis.
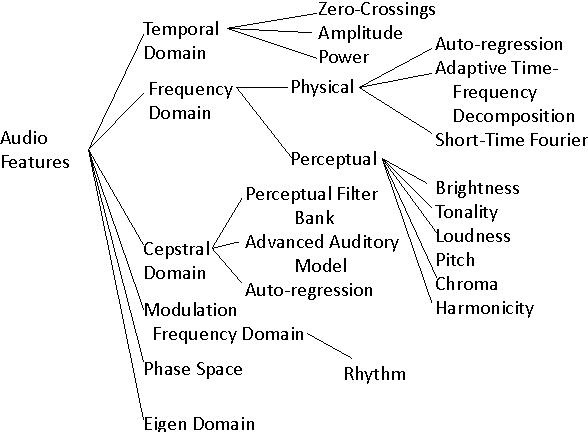
There is a plethora of audio features that could be used to identify sounds and frequencies.
